How Talent Analytics™ helped a large financial services firm save more than $4 million a year
“Employee churn can be massively expensive, and incremental improvements will give big results.”
— Greta Roberts, co-founder and CEO of Talent Analytics
A large international financial services firm based in the U.S. approached Talent Analytics with a problem. They hired nearly 30,000 Customer Service Reps (CSRs) a year to work in their call centers. The company had a significant investment in their new hires paying for 12 weeks salary and training before the CSRs took a single call but only a fraction (less than ½) of those hired
would become productive employees.
Some 20% of new hires dropped out voluntarily before the end of the 12-week class. Approximately 33% made it through the 12 weeks of training, but failed the required Series 7 Exam at the end of the training. Out of every class of 80 new employees, only 37 made it through the end of the training and passed their exam. This attrition, in just one subset of their employees, was costing the company millions of dollars a year.
“Employee churn can be massively expensive, and incremental improvements will give big results,” says Greta Roberts, co-founder and CEO of Talent Analytics.
When the company approached Roberts they had already run some analytics to try to understand their attrition challenge. However, traditional talent metrics like prior experience, compensation, education levels, etc., had failed to uncover clues as to why people were leaving or how to predict who would pass the exam.
“Running analytics on HR data—hire date, salary, benefits, etc.— to find patterns is pretty typical, but it really isn’t that effective,” says Roberts. “HR is just a little stopping point in an employee’s path, and the information gathered there is largely demographic. What matters much more are performance measures, but that data tends to be outside of HR—and disconnected from
anything HR sees.”
Roberts was convinced that if they could find the right variables they could uncover the “raw talent profile” that would not only better predict the new hires that would pass the test, but those who would become the strongest performers on the job.
Roberts recommends that you start any predictive analytics project with a cost modeling assignment so you know exactly what employee churn is costing you today. “It’s a very measurable ROI, especially in high turnover positions like call centers,” she says.
(For a detailed description of how to do Cost Modeling, including a link to R code you can use, see the How to calculate the costs of employee churn section at the end of this case study.)
If you’ve attempted an employee cost analysis you’ve probably seen that while the analysis may be simple, to yield the most useful information you need to be able to define performance.
Much of the HR data—hire date, compensation, etc.—is clearly defined (and thus easy to analyze. It’s important to have performance measures that are equally clearly defined, easy to access, and easy to use in predictive models.
“You need to be consistent in your definition of what is a top performer and what is a poor performer,” Roberts says. “Sometimes the biggest hurdle is simply insisting on a quantitative definition when working with a group that isn’t used to working that way.”
Working with the financial services company, Robert’s team considered metrics of a top performing CSR that included things like length of employment, call times, call quality, # of calls completed and single-call close scores.
“What is great about call center positions is that the process is scripted,” Roberts explains. “So you would assume since everyone is doing exactly the same thing, they would perform identically as well. And, of course, they do not. From a data science standpoint, it’s the perfect petri dish.”
Once the team established (and standardized) criteria for identifying a top-performing customer service rep, they selected 775 current CSRs (identified as either top or bottom performers) to be part of the study. Talent Analytics has a proprietary aptitude questionnaire that looks at 11 personality metrics.
Raw talent scores were derived from that process and combined with key performance indicators. Statistical analysis was then applied to look for correlations between raw talent characteristics and top/bottom CSR performance.
According to Roberts, typically 3–5 of the metrics from their Rapid Data Collection process will prove to be predictive of performance in a specific role;
in this case 4 metrics were significant predictors.
One of the metrics that proved predictive, attention to detail, was no surprise. Another, how process oriented the employee was, was also not a surprise, but the fact that it was not as highly indicative as initially assumed was instructive. “It turns out that those with the highest process orientation scores took fewer calls and had lower single-call close rates,” says Roberts.
The two highest predicting metrics, curiosity and listening, were eye opening. “HR was, understandably, hiring people who they viewed as friendly and out going to be the first point of contact for customers. Those with high listening scores are often not extroverted, but they out-performed all others. That insight changed the way HR viewed candidates.”
“Your models can’t be static. Businesses change. You want to make sure that the model is implemented, that it’s owned by someone, and the new performance data is added in so it continues to reflect the reality you are facing,” says Roberts. “The models will become more and more finely tuned as you go along.”
Furthermore, different performance measurements will create entirely different predictive models. The metrics that predict success for a CSR for example, probably won’t apply to a bank teller. This same organization has a 65% attrition rate in bank tellers. They are starting to use predictive analysis on tellers to reduce the churn in that position. “This will not only reduce costs associated with teller churn,” says Roberts, “but it will also give HR an additional tool in hiring. If, for example, someone applies for a CSR position and has a score that would indicate a low expectation of success as a CSR, but has a high probability of being successful as a high-performing teller, HR can suggest the candidate would be a better match for an open teller position.”
From the predictive analytics performed, Talent Analytics created a model that predicts specific performance required by the Call Center. Talent Analytics’ model deployment platform, Advisor™, allows HR and the hiring team to administer a questionnaire to applicants. Their scores are instantly compared to the predictive model and a gap analysis is conducted comparing their scores to that of the predictive model.
As a pilot program over the next 8 months, HR screened 952 people with their traditional screening methods, resulting in 682 rejected and 270 accepted. The 270 were then screened using the newly created predictive model and 97 were rejected and 173 were accepted. The organization is now moving from a theoretical data science project into practical administration.
After adding the predictive modeling during the hiring process, the true positive (those predicted to pass the exam who actually do) increased from 47% to 59%. But more importantly, the false positives scenario (those who are hired but failed the exam) that costs the company money without yielding any results, decreased from 49% to 35%. This resulted in a cost savings of more than $4 million a year.
 Calculating employee churn is very similar to calculating the expected rate of return or lifetime value for customers.
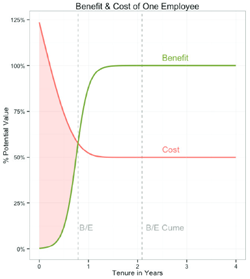
Sounds simple, right? An employee’s net value = (benefit – cost). Talent Analytics has done this with R (see at the right), but you could do it in Excel or even on the back of an envelope. A new hire usually ramps up to full value over a few months. The figure at the right shows a cost benefit plot for an imaginary employee. At time zero, costs are high: recruitment,
training, supplies, etc. In this example, the employee starts providing some value at 10 months, but doesn’t ramp up to full productivity until 12 months, and doesn’t break-even until 2.5 years. This will vary, of course, but this sigmoid curve is pretty common.
“Running analytics on HR data – hire date, salary, benefits, etc.—to find patterns is pretty typical, but it really isn’t that effective…”
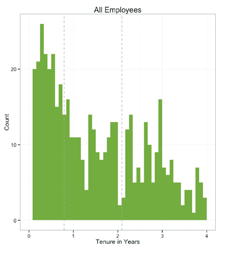
Next, create an attrition histogram. The figure above shows a pretty basic attrition histogram: the horizontal X axis shows the number of years of tenure in a specific role, the vertical Yaxis is the number of employees who reached that level of tenure.
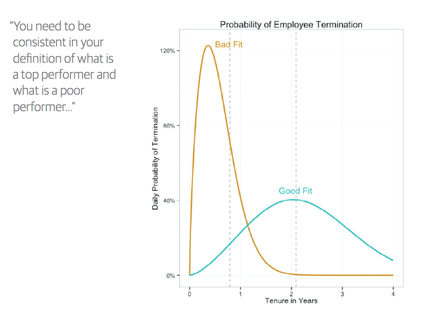
But a simple attrition histogram won’t give you the entire story. Some employees who leave a position may have been promoted out; others may have been fired. Roberts recommends taking it one step further to create a histogram that separates “bad fits” and “good fits” (or high and low performers). The figure above illustrates this. If you use termination codes it shouldn’t be hard to classify most employees who have left as either a good or bad fit.
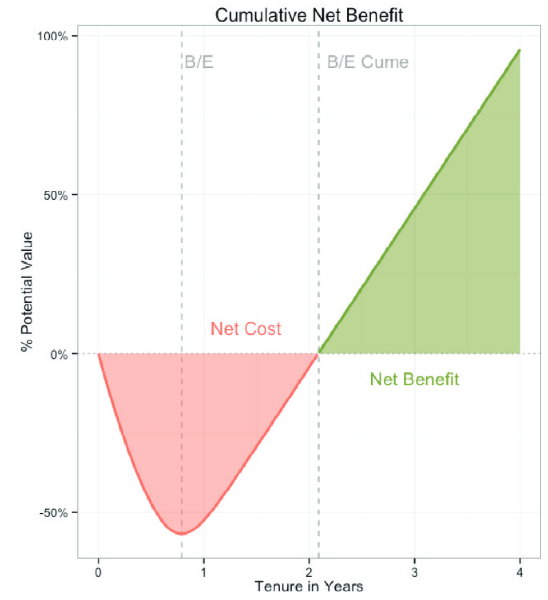
From there you can calculate the expected value at each tenure (multiply the probability of reaching a particular tenure by the net value of the tenure). Examine your mix of good fit/bad fit clusters (in the example below, Talent Analytics posited a 60% good fit to 40% bad fit ratio). Multiply each cluster’s expected curve value by the good/bad ratio to get the expected cumulative net benefit.
Talent Analytics has put the R code for these on GitHub so you can play with the code to build cost/benefit models/plots, run interactive simulations of hiring costs, calculate the expected value of hiring, etc. You’ll find it at: github.com/talentanalytics/churn201
The graphs, plots, and examples shown here were graciously provided by Talent Analytics talentanalytics.com


