Excerpted from Chapters 2 and 9 of his book Applied Predictive Analytics (Wiley 2014, http://amzn.com/1118727967)
The determination of what is considered a good model depends on the particular interests of the organization and is specified as the business success criterion. The business success criterion needs to be converted to a predictive modeling criterion so the modeler can use it for selecting models.
If the purpose of the model is to provide highly accurate predictions or decisions to be used by the business, measures of accuracy will be used. If interpretation of the business is what is of most interest, accuracy measures will not be used; instead, subjective measures of what provides maximum insight may be most desirable. Some projects may use a combination of both so that the most accurate model is not selected if a less accurate but more transparent model with nearly the same accuracy is available.
Details about the meaning of the success criteria for classification and estimation models mentioned here can be found in my book (Chapter 9) or in any good predictive analytics texts.
For classification problems, the most frequent metrics to assess model accuracy is Percent Correct Classification (PCC). PCC measures overall accuracy without regard to what kind of errors are made; every error has the same weight. Confusion matrices are also commonly used for classification and provide a summary of the different kinds of errors, called Type I and Type II errors, precision and recall, false alarms and false dismissals, or specificity and sensitivity; these are merely different ways of describing different ways the classifier makes errors. PCC and the confusion matrix metrics are good when an entire population must be scored and acted on. For example, if customers who visit a web site are to be served customized content on the site based on their browsing behavior, every visitor will need a model score and a treatment based on that score.
If one will treat a subset of the population, a selected population, sorting the population by model score and acting on only a portion of those entities in the selected group can be accomplished through metrics such as Lift, Gain, ROC, and Area Under the Curve (AUC). These are popular in customer analytics where the models selects a sub-population to contact with a marketing message, or in fraud analytics when the model identifies transactions that are good candidates for further investigation.
For continuous-valued estimation problems, metrics often used for assessing models are R^2, average error, Mean Squared Error (MSE), median error, average absolute error, and median absolute error. In each of these metrics, one first computes the error of an estimate—the actual value minus the predicted estimate—and the computes the appropriate statistic based on those errors. The values are then summed over all the records in the data.
Average errors can be useful in determining whether the models are biased toward positive or negative errors. Average absolute errors are useful in estimating the magnitude of the errors (whether positive or negative). Analysts most often examine not only the overall value of the success criterion, but also examine the entire range of predicted values by considering scatter plots of actual versus predicted values or actual versus residuals (errors).
In principal, one can also include rank-ordered metrics such as AUC and Gain as candidates to estimate the success criteria, though they often are not included in predictive analytics software for estimation problems. In these instances, one needs to create a customized success criterion.
Sometimes none of the typical success criteria are sufficient to evaluate predictive models because they do not match the business objective. Consider the invoice fraud example described earlier. Let’s assume that the purpose of the model is to identify 100 invoices per month to investigate from the hundreds of thousands of invoices submitted. If one builds a classification model and selects a model that maximizes PCC, we can be fooled into thinking that the best model as assessed by PCC is good, even though none of the top 100 invoices are good candidates for investigation. How is this possible? If there are 100,000 invoices submitted in a month, we are selecting only 0.1 percent of them for investigation. The model could be perfect for 99.9 percent of the population and miss what we care about the most, the top 100.
In situations where there are specific needs of the organization that lead to building models, it may be best to consider customized cost functions. In the fraud example, we want to identify a population of 100 invoices that is maximally productive for the investigators. If the worst scenario for the investigators is to pursue a false alarm, a case that turns out to not be fraudulent at all, the model should reflect this cost in the ranking. What modeling metric does this? No metric addresses this directly, though ROC curves are close to the idea; one could therefore select models that maximize the area under the ROC curve at the depth of 100 invoices. However this considers true alerts and false alarms as equally positive or negative. One solution is to consider the cost of false alarms greater than the benefit of a true alert; one may penalize false alarms ten times as much as a true alert. The actual cost values are domain specific, derived either empirically or defined by domain experts.
Another candidate for customized scoring of models includes Return On Investment (ROI) or profit, where there is a fixed or variable cost associated with the treatment of a customer or transaction (a record in the data), and a fixed or variable return or benefit if the customer responds favorably. For example, if one is building a customer acquisition model, the cost is typically a fixed cost associated with mailing or calling the individual; the return is the estimated value of acquiring a new customer. For fraud detection, there is a cost associated with investigating the invoice or claim, and a gain associated with the successful recovery of the fraudulent dollar amount.
Note that for many customized success criteria, the actual predicted values are not nearly as important as the rank order of the predicted values. If one computes the cumulative net revenue as a customized cost function associated with a model, the predicted probability may never enter into the final report, except as a means to threshold the population into the “select” group (that is to be treated) and the “nonselect” group.
In general, the assessment used should be the one that most closely matches the business objectives defined at the beginning of the project during Business Understanding. If that objective indicates that the model will be used to select one-third of the population for treatment, then model gain or lift at the 33 percent depth is appropriate. If all customers will be treated, then computing AUC for a batch metric may be appropriate. If the objective is to maximize selects subject to a maximum false alarm rate, a ROC is appropriate.
The metric used for model selection is of critical importance because the model selected based on one metric may not be a good model for a different metric.
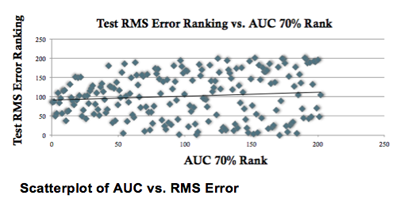
Consider the figure below containing a scatter plot of 200 models and their rank based on AUC at the 70 percent depth and the root mean squared (RMS) error. The correlation between these two rankings is 0.1—almost no relationship between the two rankings; the ranking based on AUC cannot be determined at all from the ranking of RMS error. Therefore, if you want to use a model operationally in an environment where minimizing false positives and maximizing true positives is important, choosing the model with the best RMS error model would be sub-optimal.
In summary, assessing models requires far more than knowing a handful of metrics. We, as analysts, need to understand the intent of the model and match the metric we use to that intent. This could be a global metric that treats every record alike, such as R^2 or PCC, or it can be a rank-ordered metric such as lift at a predetermined depth or an ROI calculation. Using the right metric can have more influence on you model performance than the algorithm you use.
Author Bio:
Dean Abbott is Co-Founder and Chief Data Scientist of Smarter Remarketer, Inc., and President of Abbott Analytics, Inc. in San Diego, California. Mr. Abbott is an internationally recognized data mining and predictive analytics expert with over two decades of experience applying advanced data mining algorithms, data preparation techniques, and data visualization methods to real-world problems, including fraud detection, risk modeling, text mining, personality assessment, response modeling, survey analysis, planned giving, and predictive toxicology.


For the first time ever, team up with or challenge your friends in the iconic levels of super mario 64 online.