If, as Niels Bohr maintained, an expert is a person who has made all the mistakes that can be made in a narrow field, we consider ourselves expert data scientists. After twenty years of doing what’s been variously called statistics, data-mining, analytics and data-science, we have probably made every mistake in the book—bad assumptions about how data reflects reality; imposing our own biases; unjustified statistical inferences and misguided data transformations; poorly generalized deployment; and unforeseen stakeholder consequences. But at least we’re not alone.
We believe that studying all the ways we get it wrong suggests a powerful “test driven” approach that can help us avoid some of the more egregious mistakes in the future. By extending the principles of test-driven development, we can prevent some errors altogether and catch others much earlier, all without sacrificing the rapid, iterative, “train of thought” analysis cycle that is fundamental to successful data-science.
Let’s step back. The successful data scientist applies the traditional scientific method to draw useful conclusions about some phenomenon based on some (perhaps big!) data that reflects it. Although non-practitioners often view data analysis as a monotonous, mind-numbing process where the analyst feeds in the input data, turns a crank, and produces output, in reality there are many choices to be made along the way, and many pitfalls to catch the unwary. The “art” of data science is about choosing “interesting questions” to ask of the data: the hypotheses demanded by the scientific method. These hypotheses are tested, revised and refined, and ultimately lead to conclusions or analytical results: typically charts, tables, predictive models and the like.
Once the analysis is complete, we’re typically left with some kind of software artifact—an “analytical process” that involves a set of steps that transform the input data into well-defined outputs. Often some or all of that process is later automated and generalized so that updated results can be generated as new data are collected or updated. But the manner in which an analytical process is created is quite different from how a traditional software program is built. Unlike a software program, where at least in principle we can specify the desired outcome before we begin, it’s precisely that specification—of the analytical results—that is the objective of data analysis. We are effectively defining our specification and the software that delivers it simultaneously. Not only that, the ultimate value of the analysis is critically dependent on how accurately our understanding of the input data and output results relate to the original phenomenon of interest.
Analytical processes can go wrong in all the same ways any piece of software can go wrong, such as crashing or producing obviously incorrect output. Data analysis also offers a plethora of new ways to fail. Insidious errors creep in when our “specification” itself is wrong. Our process can run correctly in the sense of producing the right kind of output, and not being obviously wrong, but cause us to draw completely invalid conclusions. These specification errors are often not discovered until much later, if at all. Similarly our process may fail in unexpected ways when presented with new or updated data.
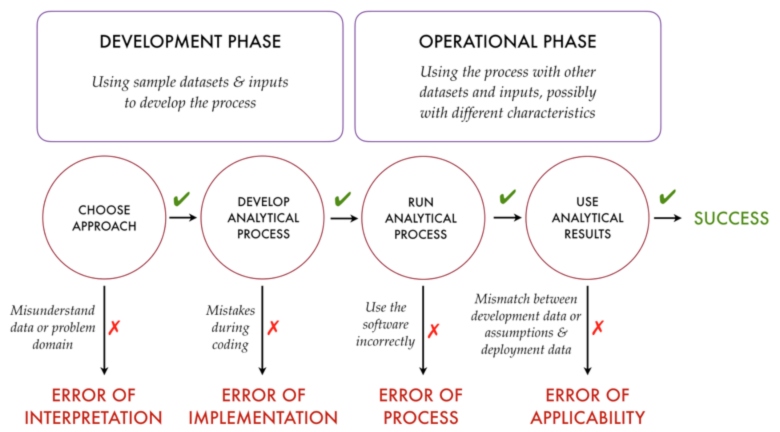
As shown below, we identify four broad categories of analytical process failure, although in practice such a classification will never be perfectly precise: Anyone familiar with software development will know that in many cases bugs can be (and are!) converted into features simply by documenting the “erroneous” behaviour as part of the spec.
 Click to Enlarge
1. Errors of Implementation. The most basic kind of error is where we just get the program wrong—either in obvious ways like multiplying instead of dividing—or in subtler ways like failing to control an accumulation of numerical errors (e.g. a Patriot Missile failure during the first Gulf War that resulted in more than 100 casualties). The twist with data analysis is that it might be quite hard to detect that the results are wrong, especially if they are voluminous.
2. Errors of Interpretation. Our analysis always depends on the data we consume and produce being correct in two senses: the values must be accurate and they must mean what we think they mean. Even when the first is true, often our misunderstandings and misinterpretations obscure our picture of reality, leading us unknowingly to draw fallacious conclusions. For example, despite much initial hype Google Flu doesn’t accurately forecast disease outcomes based on search behavior since most people don’t have a good understanding of flu symptoms. Even the questions we ask can be the wrong questions, as Tukey observed:
“Far better an approximate answer to the right question, which is often vague, than an exact answer to the wrong question” – J. Tukey, The Future of Statistical Analysis
3. Errors of Process. Applying statistical methods or inferences correctly often require that specific assumptions be satisfied. Data transformations often have unpredictable consequences in the face of unexpected data (missing or duplicate values being a common problem) and can lead to unjustifiable results. There are several great collections of how statistics are done wrong, and the spectacular failure of the Mars Orbiter due to incompatible units is a canonical illustration of failure due to different units being mixed used without appropriate conversions.
4. Errors of Applicability. An ad hoc approach is common during initial data exploration. But this can result in an analytical process that is overly specific to the initial dataset, making it difficult to repeat or apply to updated data with slight differences. Although this sometimes results in easily detectable “crashes”—such as when an unexpected value appears or is missing—it can also lead to otherwise inappropriate conclusions in production. The best known examples of this are overfitting a training dataset, leading to models that don’t perform well in production (e.g. Walmart’s recommendation engine failure), but even analyses not involving predictive modelling often “wire in” assumptions and values, making the analytical process of limited applicability.
So what can be done? Several years ago, as we began to realize the benefits of Test Driven Development in our traditional software development, we asked ourselves whether a similar methodology could inform and improve our approach to data analysis. We believe that the principles of test-driven development provide a promising approach to catching and preventing many of these kinds of errors much earlier. This might well require improvements to the tools we use in order to preserve the speed and flexibility of ad hoc analysis that we’ve come to expect:
We still just beginning to explore these ideas, but they are already delivering tangible value in production environments. If you’d like to learn more, or share your own experiences, please join the conversation atwww.tdda.info and @tdda.
 Patrick Surry: Travel Expert and Chief Data Scientist
As Chief Data Scientist at Hopper, Patrick Surry analyzes flight data to help consumers make smart travel choices. Patrick is recognized as a travel expert and he frequently provides data-driven insight on the travel industry and airfare trends.
Patrick’s studies and commentary are frequently featured in outlets such as New York Times, USA Today, Wall Street Journal, TIME, among many others. Patrick also regularly appears on various broadcast stations to offer travel insight and tips.
Patrick holds a PhD in mathematics and statistics from the University of Edinburgh, where he studied optimization based on evolutionary algorithms, following an HBSc in continuum mechanics from the University of Western Ontario.
Patrick is always happy to provide data analysis or commentary for any travel-related stories. If you’re a media professional and would like to contact Patrick, please email research [at] hopper [dot] com. You can also follow Patrick on Twitter at @PatrickSurry.
Nick Radcliffe, founder, Stochastic Solutions
Stochastic Solutions was founded by Nicholas Radcliffe to help companies with targeting and optimization.
Prior to founding Stochastic Solutions, Radcliffe founded and acted as Chief Technology Officer for Quadstone Limited, an Edinburgh-based software house that specialized in helping companies to improve their customer targeting. While there, he led the development of a radically new algorithmic approach to targeting direct marketing which has repeatedly proved capable of delivering dramatic improvements to the profitability of both traditional outbound and more modern inbound marketing approaches, in an approach known as uplift modelling. Quadstone was acquired by Portrait Software in late 2005.
Through working with many companies in financial services, telecommunications and other sectors, it became clear to Radcliffe that uplift modelling can provably increase the profitability of direct marketing for most large B2C companies. However, it became equally clear that there are many non-analytical challenges that prevent the majority of companies from being ready even to evaluate this approach at present, let alone to benefit from it. One of the founding visions of Stochastic Solutions is to help companies improve their approach to the systematic design and measurement of direct marketing activities in ways that bring immediate benefits while also preparing them to be able to evaluate properly the potentially huge benefits of adopting this radical new approach. The concepts around uplift modelling are discussed in his blog, The Scientific Marketer.
Radcliffe is also a Visiting Professor of Mathematics at the University of Edinburgh, working in the Operational Research group. His research has focused on the use of randomized (stochastic) approaches to optimization, and he was one of the early researchers in the now established field of genetic algorithms and evolutionary computation. He has over many years successfully applied stochastic methods to real-world industrial and commercial problems as diverse as retail dealership location, credit scoring, production scheduling and gas pipeline design, and has published several dozen research papers in the area. He has also, while at Quadstone, combined stochastic optimization with data mining to allow new classes of problems to be tackled.


