


Six Ways to Lower Costs
with Predictive Analytics
By Eric Siegel, Ph.D.
Conference Chair, Predictive Analytics World
Originally published on BeyeNETWORK.
"If you would be wealthy, think of saving as well as getting."
- Benjamin Franklin
"Money is better than poverty, if only for financial reasons."
- Woody Allen
Question: How does predictive analytics actively deliver increased returns? Answer: By driving operational decisions with predictive scores - one score assigned to each customer. In this way, an enterprise optimizes on what customers will do (for a concise introduction to predictive analytics, see my article, Predictive Analytics with Data Mining: How It Works, and visit the Predictive Analytics Guide).
But, in tough times, our attention turns away from increasing returns, and towards decreasing costs. On top of boosting us up the hill, can predictive analytics pull us out of a hole? Heck, yes. Marketing more optimally means you can market less. Filtering high risk prospects means you will spend less. And, by retaining customers more efficiently, well, a customer saved is a customer earned - and one you need not acquire.
It's true that predictive analytics is more than a cost-cutter—it's usually leveraged to increase revenue and profit (see my BeyeNETWORK article, Predictive Analytics Delivers Value Across Business Applications). However you use it, this technology improves efficiency and optimizes by driving decisions more effectively. But it turns out many applications of predictive analytics can be positioned for cost reduction specifically. Keep it in mind that painting a picture of lowering expenses can do wonders for internal sales as you gain traction for predictive analytics initiatives.
Without further ado, here are six ways predictive analytics lowers costs without decreasing business, thus transforming your enterprise into a Lean, Mean Analytical Machine. The following table provides an overview of the six cost-slashing value propositions, including links to pertinent brand name case studies from Predictive Analytics World, and the rest of this article provides a detailed description of each cost-cutter. And at the very end of this article, below, is another table with five additional cost-cutting applications.
| Business application: | How it cuts costs: | Case studies at PAW: | |
| 1. | Response modeling for direct marketing | Don't contact those who won't respond | 2009: Lifeline, PREMIER, Sun |
| 2. | Uplift response modeling
| Don't contact those who'd respond anyway |
2010: Charles Schwab |
|
| 3. | Targeted retention with churn modeling (related article)
| Don't waste expensive retention offers on those who'll stay anyway |
2009: Reed Elsevier, Optus |
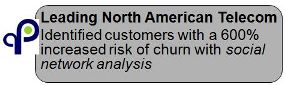
2010: Leading Telecom |
| 4. | Churn uplift modeling
| Don't trigger those who'd otherwise stay to leave |
2009: Telenor |
|
| 5. | Risk modeling
| Don't acquire "loss customers" |
2009:
Pinnacol, Wells Fargo, Zurich |
2010: NSA, Younoodle |
| 6. | Fraud detection
| Don't let thieves get away with it, or expend fewer staff resources on fraud |
2009: Citizens Bank, more |
2010: 1-800-Flowers |
1. Response Modeling for Direct Marketing
Response modeling to target direct marketing is perhaps the most established business application of predictive analytics. By learning from the experience gained during prior campaigns, observing which customer did or did not respond to solicitations in the past, today's list of prospects can be scored according to who's most likely to respond tomorrow. Then, target only those customers assigned a sufficiently high score. By only expending the cost of contact - be it via direct mail or phone banking - on those more likely to respond, a direct marketing campaign gets more "bang for its buck": a higher response rate. This translates into a significantly better bottom line.
The performance of a predictive model is often measured in terms of lift, most commonly depicted in the form of a gains chart:
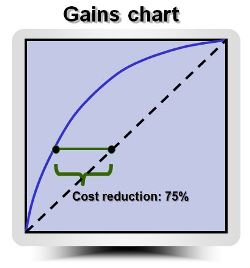
As practitioners know, the higher the curve is above the diagonal, the better the model. But it is easy to forget that it isn't the absolute distance from the dotted diagonal line that matters - it's the "Manhattan distance," that is, the vertical or horizontal distance.
For the cost savings generated by a model with the lift curve above, look to the horizontal distance from the diagonal. Let's say you have the marketing budget to contact 40% of the customers on your list. If you had no predictive model and no means to identify which customers are more likely to respond, your list is essentially in random order. This means, on average, any 40% selected would include 40% of the totally responses - i.e., the rightmost point of the two shown that sits right on the diagonal.
But with the help of the predictive model, the same 40% of responses can be solicited by only contacting the top 10% scored as most likely to respond - i.e., the leftmost point that sits right on the curve. That's only one fourth as many to contact - a cost savings of 75%.

Since this top 10% contains 40% of all possible responders - 4 times as many as an average random sample of 10% - the model is said to attain a lift of 4.
Here are some pertinent case-study results, as reported at Predictive Analytics World (click for more information):


2. Uplift Modeling for Direct Marketing
Having just lauded its value, I'm now going to turn around and tell you that, in general, standard response modeling actually aims to maximize the wrong thing! A direct marketing campaign's effectiveness isn't its response rate, it's the incremental impact - that is, the additional revenue directly attributable to the campaign that would not otherwise have been generated.
Even if a campaign targeted with response modeling is showing a high rate of response and therefore a great profit, there remains a fundamental, unanswered question: What about those responders who would have made a purchase anyway? In some cases, up to half - or even more - were so prone to purchasing, they would have done so via another channel even if not contacted. This is where many experts, including even the most senior analytics practitioners, proclaim, "Doh!"
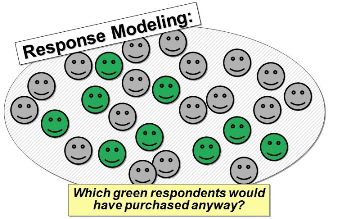
Indeed, rather than predict whether each customer is likely to respond, the more advantageous prediction goal is, "Will the customer respond... and not buy even without contact?"
Enter uplift modeling - A.K.A. net lift modeling, incremental modeling, impact modeling, or differential response modeling - which scores each customer according to which of four conceptual segments she belongs in:
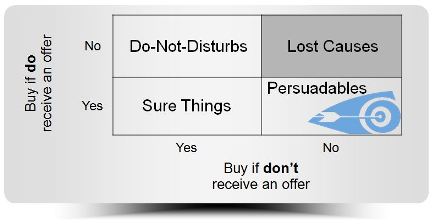
This quad first distinguishes from top to bottom which customers will respond to an offer, which is the job of traditional response modeling. But then it further distinguishes along a second dimension: Which customers will make a purchase even if not contacted?
The lower-right quadrant includes those customers to target, those worthy of expending the cost of contact. These are the "persuadables," who won't buy if not contacted, but will buy if they are contacted. As Kim Larsen, an analytics expert at Charles Schwab, says, "These 'swing customers' are akin to the swing states of a presidential election; data miners could learn a lot from presidential campaigns." As residents of California, neither Larsen nor I saw many TV ads for the 2008 presidential campaigns.
Larsen will be presenting on his work with uplift modeling during his keynote address, "Response Modeling is the Wrong Modeling: Maximize Impact With Net Lift Modeling," at Predictive Analytics World, February 16-17, 2010 in San Francisco.
Uplift modeling delivers a clear and present opportunity to reduce costs beyond traditional response modeling: Suppress from the contact list those customers in the lower-left quadrant, the "sure things," who do indeed respond to direct marketing contact, but actually would buy anyway (perhaps a bit later, via a different channel) even without expending the cost of contacting them.

Here is a pertinent case-study result, as reported at Predictive Analytics World (click for more information):

3. Customer Retention with Churn Modeling
A wise marketing rule of thumb tells us retaining an existing customer is less costly than acquiring a new one "off the street." After all, if "a penny saved is a penny earned," the same goes for customers, doesn't it?
Picture your customer base as a balloon, with air flowing in from left - customer acquisition - and air leaking out to the right - customer attrition:
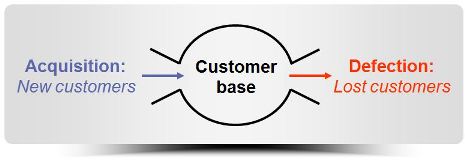
If we could decrease the attrition even just a little by squeezing the nozzle on the right, how much more quickly would the balloon be expanding? That is the growth rate of your customer base.
On the other hand, a retention offer designed to keep customers around, such as offering a hefty discount, can incur quite a cost. It isn't practical to provide such an offer to all your customers - any customer who actually wasn't on their way out, but to whom you extend the discount, amounts to an unnecessary cost best avoided.
Churn modeling (a.k.a, attrition modeling) predicts who's leaving. By scoring each customer according to their risk of departure, expensive retention offers can be targeted effectively, avoiding where possible those customers that were going to stick around anyway.
Customer retention with churn modeling is a white hot application of predictive analytics. Along with response modeling and product recommendations for cross-sell, it is probably in the top three applications, and is often the lowest-hanging fruit amongst the various value propositions predictive analytics has to offer for your organization. For more information about churn modeling, see my article, Predictive Analytics' Killer App: Retaining New Customers.
Here are some pertinent case-study results, as reported at Predictive Analytics World (click for more information):


4. Churn Uplift Modeling
"Let sleeping dogs lie."
It turns out that employing uplift modeling so that a secondary "predictive dimension" can be incorporated into churn modeling delivers tremendous performance improvements, just as doing so helped response modeling in Section 2 above. With churn uplift modeling, each customer is scored according to these four conceptual segments (this figure was derived from the FORRESTER whitepaper, Optimizing Customer Retention Programs):
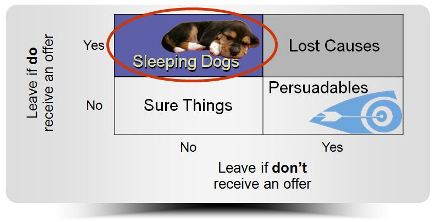
This quad first distinguishes from left to right which customers will defect if not contacted with the retention offer, which is the job of traditional churn modeling. But then it further distinguishes along a second dimension: Which customers will leave if they do receive the retention offer?
As was the case for response modeling, the lower-right quadrant includes those customers to target, those worthy - in this case - of expending the cost not only of contact, but, more significantly, worthy of expending the much greater cost incurred by the retention offer. These are the "persuadables" - or "savables" - who will defect if not contacted, but who can be convinced to stay with the retention offer.
We turn to the upper-left quadrant for a new opportunity to reduce costs beyond traditional retention with churn modeling. These "sleeping dogs" will stick around if left alone, but, if we contact them with the retention offer, it will trigger an adverse, reverse effect: the customer will get up and leave. Being passive where contact would "scare away" customers is certainly a great way to cut costs.

Many businesses face the risk of an adverse response to retention outreach. Cell phone carriers often offer a free phone to consumers when their one- or two-year commitment is up in exchange for signing another contract. For some subscribers, this serves only to remind them they're now free to defect to a competitor - churn uplift modeling predicts which customers will respond in which way. Similarly, other subscription services such as online dating sites, video rental services and health clubs have certain customers who don't use the service at all, but are charged periodically anyway. A retention offer may remind them to finally get around to canceling. Finally, any and all types of business may have customers who respond adversely to what they consider to be bothersome or unnecessary contact.
Here is a pertinent case-study result of applied uplift churn modeling, as reported at Predictive Analytics World (click for more information):

Uplift modeling also improves the performance of many business applications beyond response and churn modeling. In general, this analytical method can be used to maximize the choice between two "treatments" of each customer, whether it is the choice of which ad or product to display, or the choice between contact or no contact at all. Larsen's keynote address at February 2010's PAW conference, mentioned above, will reveal additional such applications.
Here is a pertinent case-study result applying uplift modeling to select which product to recommend for cross-sell campaigns, as reported at Predictive Analytics World (click for more information):

5. Risk Management
I witnessed an unintended consequence while hurtling myself down a mountain February of 2009:

The image on the left is a real picture of me skiing in Utah, completely undoctored. The image on the right, not so completely undoctored.
Did my health insurance provider take a good risk in approving my application for coverage? If the objective of a health insurance company is strictly financial profit, the answer is an absolute, "No," given today's cost of knee surgery (personal note: it went well and I expect to ski again in 2011).
By identifying applicants with a greater risk of submitting higher aggregate claims, insurance providers can more effectively drive selection and pricing decisions in order to minimize loss ratio.

Other analytical efforts target prophylactic measures to reduce the need for - and cost of - treatment. Proactive intervention is targeted to the patients with higher health risks (see this related white paper (PDF file)); property & casualty insurance providers reportedly predict which homes are more at risk for certain devastating mold. The UK's largest fire brigade predicts which homes are most at risk.
Beyond health and accidents, each time a financial institution issues credit or an investor invests there is risk to be managed. Most leading credit card issuers perform risk scoring with predictive models to drive application decisioning. And startup companies are statistically modeled in order to predict their success, guiding the allocation of venture capital.
This brings us to an overarching cost reduction opportunity presented by risk modeling:

Risk extends into the public sector as government agencies predictively score watchlists of suspects; the NSA conducts risk profiling by augmenting traditional data analysis with text mining.
Looking at the big picture, all business applications of predictive
analytics are really one sort of risk management or another. The very
business model of an insurance company is to pool risk as effectively
as possible, transforming risk to opportunity. Similarly, any
business gains competitive advantage by identifying which customers
are at risk of defection, at risk of consuming a retention discount
even if they were not going to leave, at risk of not responding to an
expensive, glossy mailer, or, as addressed in the next Section below,
at risk of committing fraud. If business is a "numbers game,"
predictive analytics is the way to play it.
6. Fraud Detection

As transactions become increasingly numerous and automated, criminal opportunities abound. Across industry verticals, fraudulent transactions such as invoices, credit card purchases, tax returns, insurance claims, mobile phone calls, online ad clicks, and consumer banking checks incur great cost.
Detecting fraud at the moment it is attempted - or as soon thereafter as possible - is the name of the cost-cutting game (detection is a kind of prediction in so much as a transaction is predictively scored as to whether it will turn out to be fraudulent, or that an expert will label it as fraud). In some commercial deployments, analytical detection blocks or denies authorization requests in real time. In others, it provides sufficient lead time for investigators to prevent or recoup losses, and possibly prosecute the perpetrator.
Here is a pertinent case-study, to be reported at Predictive Analytics World, February 16-17, 2010 (click for more information):

There are two ways fraud detection empowers a team of auditors to cut costs. First, more fraud may be detected. Since a team of investigators can only inspect a certain number of suspected transactions each week, delivering a more precisely identified pool of relatively likely candidates of fraud means their time is used more effectively - more of the transactions they screen will turn out to be fraud indeed.


Second, if the current level of fraud detection is satisfactory, it can be maintained with fewer human resources by delivering a more precise pool of candidates; auditors will find more fraud per day, so fewer auditors are required.

Five More "Bonus" Cost-Cutters
It doesn't stop there. Organizations are leveraging predictive analytics in a growing and seemingly endless number of ways in order to achieve desired results, including cost-savings specifically. I'll conclude now with the following table, which lists five additional cost-slashing value propositions, and provides links to pertinent brand name case studies from Predictive Analytics World.
| Business application: | How it cuts costs: | Case studies at PAW: | |
| 7. | Call center and customer service prediction
| Allocate/triage premium VIP customer care resources |
2010: Abbott Analytics,
CAA,
BBC |
|
| 8. | Predict online ad bounce rate (PDF tech paper)
| Don't pay for clicks that will bounce |
2010: Google |
|
| 9. | Application processing
| Don't spend as much time on likely denials; don't make approved customers wait too long |
2009: Infinity |
2010: SSA |
| 10. | System failure prediction - of both hardware and corporate processes
| Proactively nip failure "in the bud" |
2010: Visa, Army |
|
| 11. | Human resource performance and attrition modeling
| Target HR department and managerial resources effectively, and avoid lossy hires |
(Coming to future PAWs) |
|
About the author: Eric Siegel, Ph.D.
The president of Prediction Impact, Inc., and the program chair for Predictive Analytics World, Eric Siegel is an expert in predictive analytics and data mining and a former computer science professor at Columbia University, where he won the engineering school's award for teaching, including graduate-level courses in machine learning and intelligent systems - the academic terms for predictive analytics. After Columbia, Dr. Siegel co-founded two software companies for customer profiling and data mining, and then started Prediction Impact in 2003, providing predictive analytics services and training to mid-tier through Fortune 100 companies.
Dr. Siegel is the instructor of the acclaimed training program, Predictive Analytics for Business, Marketing and Web, and the online version, Predictive Analytics Applied. He has published over 20 papers and articles in data mining research and computer science education, has served on 10 conference program committees, and has cochaired an Association for the Advancement of Artificial Intelligence Symposium held at MIT.