
Much has been written about customer churn – predicting who, when, and why customers will stop buying, and how (or whether) to intervene. Employee churn is similar – we want to predict who, when, and why employees will terminate. In many ways, it is smarter to to focus inward on employees. For one thing, it is far easier for an company to change the operations or even the behavior of an employee, than that of a customer. As will be seen, employee churn can be massively expensive, and incremental improvements will give big results.
The most important difference between employee vs. marketing churn is that a business chooses to hire someone. Unfortunately, you usually don’t get to choose your customers. There is also more at stake – this person will literally be the face of your company, and collectively, the employees produce everything your company does.
Employee churn has unique dynamics compared to other problems. To jump-start the “business understanding” phase of analytics efforts, we are writing a series of articles to translate employment processes into tractable data mining problems.
A new hire ideally ramps up to full productivity over months, going through on-boarding, training, certification. In one client engagement, a call center employee had to train for months to pass a Series 7 exam, before even being legally allowed on the phone. During all of that time, an employee delivered no value… they were just preparing to start working.
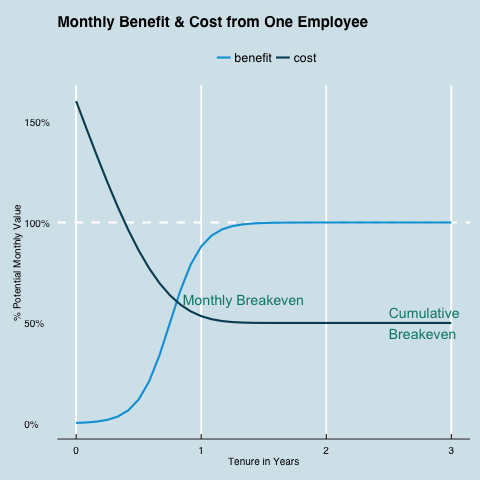
Figure 1 shows a stylized cost/benefit plot for one employee across three years of tenure. At time zero, costs are very high – an expensive recruitment process, administration, training, supplies are all above the normal flow. In this model, after about a year, the main monthly expense is salary and overhead. In this hypothetical job, an employee takes a year to ramp up to full productivity. Different jobs will have different curves, but this sigmoid curve is common.
To decrease the overall costs due to employee churn, something has to budge on these curves:
Like quantitative scissors, there are no other options in this model.
Unfortunately, few companies have any idea of what these costs and benefit numbers are for any given role. Many have worked out the lifetime value of a customer to 5 decimal points, but few have ever considered the lifetime value of an employee. And, not all roles are “producers” like sales reps or factory workers – for example, what is the monthly corporate contribution of a data scientist? Data Science may be “the sexiest job of the 21st century”, but no one really knows how much we “make it rain.”
At Talent Analytics, we have found it simpler to evaluate employee cost relative to a potential performance level. Simple heuristics can begin to build the curves defined in Figure 1. The shocker comes when we subtract (benefit – cost) and take the cumulative sum to find an break-even point..
In this stylized example, the employee starts providing monthly value after 10 months, and does not break even until after 2.5 years. By comparison, in our engagements we often see impressive attrition after just 3–6 months.
Customers provide profit right away, so customer churn analytics is just trying to keep the gravy train rolling. Employee churn analytics is more like trying to get the train to run long enough to provide any value at all.
With the employee value proposition laid out, we can begin to crack this nut and save the business some money. We are looking for signals that will let us score the likelihood of a person to stay in a role inside a given time window. By deploying the right predictive model, we can decrease the impact of one or more of the “scissor points” above.
Hint: The most powerful place to solve this problem is before you cut the first paycheck.
There is much more to this subject. In future installments, we will consider:
As an experiment, we are putting the R code for this cost model and its plots on GitHub. It is a public project for all to try, modify, and share at https://github.com/talentanalytics/churn201. Feel free to “pull request” any improvements to make this even better. We will build up this toy model as an engine for this series. Please engage!
Pasha Roberts, Chief Scientist, Talent Analytics @pasharoberts
You must be logged in to post a comment.


A very good demostration, thought provoking too.
There’s a science component to this as well as a human component. I believe this to be an extremely delicate component that doesn’t translate well into standardization. Company culture, which obviously differs widely from organization to organization and from role to role, deserves a separate segmentation of variables in and if itself.
@murphy: thanks!
@ledon: Absolutely. It is very different being a software engineer at Microsoft vs. at Apple, and it’s different being a sales rep at a giant pharma vs at a little biotech startup. Very different.
In our engagements we measure job culture down to the specific company, role, and branch office if need be. And, these need to be modeled on performance variables. The “industry-wide benchmarks” you find out there (e.g. SuccessFactors) are just too broad for much utility.
Pingback: R Helps With Employee Churn ← Patient 2 Earn
Pingback: Quick Application: Your ATS Is Blocking Job Applicants
Pingback: Quick Application: Your ATS Is Blocking Job Applicants – TMP Blog