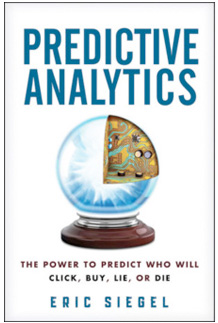
Preface from Predictive Analytics: The Power to Predict Who Will Click, Buy, Lie or Die?
Inside the Secret World of the Data Crunchers Who Helped Obama Win
Why Predictive Modelers Should be Suspicious of Statistical Tests
SAS Salford Systems Pitney Bowes logo Rising Media Prediction Impact

Predictive Analytics Times Newsletter:

Can you believe it's December? Where did 2012 go? I'm going to try to use some predictive modeling to see what 2013 has in store for us. Seriously though - at this time of year, it's great to reflect on what you've accomplished, as well as give thanks. So from everyone at PA Times, I'd like to extend our deepest gratitude. We appreciate you taking the time out of your busy schedule to read our publication and offer your feedback. We've got some exciting changes and updates in store for you in the New Year, and we look forward to continuing to bring you leading information and insight from the predictive analytics community.

Thanks again and Happy Holidays to you and yours.

Enjoy our December Issue!

Warm Regards,

Adam Kahn Adam Kahn
Publisher, Predictive Analytics Times

Not Subscribed? Sign Up For The Predictive Analytics Times Newsletter:

* required

Preface from Predictive Analytics: The Power to Predict Who Will Click, Buy, Lie or Die 1
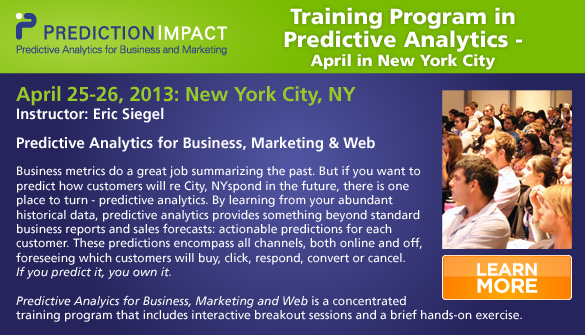
Training Program in Predictive Analytics – April in New York City 3
Why Predictive Modelers Should be Suspicious of Statistical Tests 4
Inside the Secret World of the Data Crunchers Who Helped Obama Win 7
SAS® On-Demand Webinar - How-To: Effectively Realize Data Visualization 8
Online Course: Predictive Analytics Applied – On demand any time 9
The Beating Heart of Health Care Analytics 10
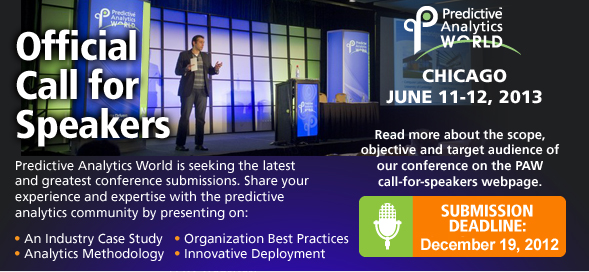
PAW Official Call for Speakers 11
ANALYTICS SOFTWARE: Salford Systems - Predictive Modeler 12
Predictive Analytics World

Predictive Analytics: Who Will Click, Buy, Lie or Die?Predictive Analytics:
The Power to Predict Who Will
Click, Buy, Lie, or Die
(forthcoming)
Eric Siegel, Chair, Predictive Analytics World

Yesterday is history, tomorrow is a mystery, but today is a gift. That's why we call it the present.

— Attributed to A.A. Milne, Bill Keane and Oogway, the wise turtle in Kung Fu Panda

People look at me funny when I tell them what I do. It's an occupational hazard.

The Information Age suffers from a glaring omission. This claim may surprise many, considering we are actively recording Everything That Happens in the World. Moving beyond history books that document important events, we've progressed to systems that log every click, payment, call, crash, crime, and illness. With this in place, you would expect lovers of data to be satisfied, if not spoiled rotten.

But this apparent infinity of information excludes the very events that would be most valuable to know of: things that haven't happened yet.

Everyone craves the power to see the future; we are collectively obsessed with prediction. We bow to prognostic deities. We empty our pockets for palm readers. We hearken to horoscopes, adore astrology, and feast upon fortune cookies.

But many people who salivate for psychics also spurn science. Their innate response says "yuck"—it's either too hard to understand or too boring. Or perhaps many believe prediction by its nature is just impossible without supernatural support.

There's a lighthearted TV show I like premised on this very theme, Psych, in which a sharp–eyed detective—a modern–day, data–driven Sherlock Holmesian hipster—has perfected the art of observation so masterfully, the cops believe his spot–on deductions must be an admission of guilt. The hero gets out of this pickle by conforming to the norm: he simply informs the police he is psychic, thereby managing to stay out of prison and continuing to fight crime. Comedy ensues.

I've experienced the same impulse, for example, when receiving the occasional friendly inquiry as to my astrological sign. But, instead of posing as a believer, I turn to humor: "I'm a Scorpio, and Scorpios don't believe in astrology."

The more common cocktail party interview asks what I do for a living. I brace myself for eyes glazing over as I carefully enunciate: predictive analytics.

Most people have the luxury of describing their job in a single word: doctor, lawyer, waiter, accountant, or actor. But, for me, describing this largely unknown field hijacks the conversation every time. Any attempt to be succinct falls flat:

I'm a business consultant in technology. They aren't satisfied and ask, "What kind of technology?"

I make computers predict what people will do. Bewilderment results, accompanied by complete disbelief and a little fear.

I make computers learn from data to predict individual human behavior. Bewilderment, plus nobody wants to talk about data at a party.

I analyze data to find patterns. Eyes glaze over even more; awkward pauses sink amid a sea of abstraction.

I help marketers target which customers will buy or cancel. They sort of get it, but this wildly undersells and pigeonholes the field.

I predict customer behavior, like when Target famously predicted whether you are pregnant. Moonwalking ensues.

So I wrote this book to demonstrate for you why predictive analytics is intuitive, powerful, and awe-inspiring.

I have good news: a little prediction goes a long way. I call this The Prediction Effect, a theme that runs throughout the book. The potency of prediction is pronounced–as long as the predictions are better than guessing. This Effect renders predictive analytics believable. We don't have to do the impossible and attain true clairvoyance. The story is exciting yet credible: putting odds on the future to lift the fog just a bit off our hazy view of tomorrow means pay dirt. In this way predictive analytics combats financial risk, fortifies healthcare, reduces spam, toughens crime fighting, and boosts sales.

continued >>>

Do you have the heart of a scientist or a businessperson? Do you feel more excited by the very idea of prediction, or by the value it holds for the world?

I was struck by the notion of knowing the unknowable. Prediction seems to defy a Law of Nature: you cannot see the future because it isn't here yet. We find a work–around by building machines that learn from experience. It's the regimented discipline of using what we do know—in the form of data—to place increasingly accurate odds on what's coming next. We blend the best of math and technology, systematically tweaking until our scientific hearts are content to derive

a system that peers right through the previously impenetrable barrier between today and tomorrow.

Talk about boldly going where no one has gone before!

Some people are in sales; others are in politics. I'm in prediction, and it's awesome.

Excerpted with permission of the publisher, Wiley, from Predictive Analytics: The Power to Predict Who Will Click, Buy, Lie, or Die (February 2013) by Eric Siegel. Copyright (c) 2013 by Eric Siegel. This book is available at all bookstores and online booksellers. For more information about predictive analytics, see the Predictive Analytics Guide.


Originally published at http://abbottanalytics.blogspot.com

Well, the danger is really not the statistical test per se, it the interpretation of the statistical test.

Yesterday I tweeted (@deanabb) this fun factoid: "Redskins predict Romney wins POTUS #overfit. if Redskins lose home game before election => challenger wins (17/18) http://www.usatoday.com/story/gameon/2012/11/04/nfl-redskins-rule-romney/1681023/" I frankly had never heard of this "rule" before and found it quite striking. It even has its own Wikipedia page (http://en.wikipedia.org/wiki/Redskins_Rule).

For those of us in the predictive analytics or data mining community, and those of us who use statistical tests to help out interpreting small data, 17/18 we know is a hugely significant finding. This can frequently be good: statistical tests will help us gain intuition about value of relationships in data even when they aren't obvious.

In this case, an appropriate test is a chi-square test based on the two binary variables (1) did the Redskins win on the Sunday before the general election (call it the input or predictor variable) vs. (2) did the incumbent political party win the general election for President of the United States (POTUS).
continued....

According to the Redskins Rule, the answer is "yes" in 17 of 18 cases since 1940. Could this be by chance? If we apply the chi-square test to it, it sure does look significant! (chi-square = 14.4, p < 0.001). I like the decision tree representation of this that shows how significant it is (built using the Interactive CHAID tree in IBM Modeler on Redskin Rule data I put together here):

It's great data--9 Redskin wins, 9 Redskin losses, great chi-square statistic!

OK, so it's obvious that this is just another spurious correlation in the spirit of all of those fun examples in history, such as the superbowl winning conference predicting if the stock market would go up or down in the next year at a stunning 20 or 22 correct. It even was the subject of academic papers on the subject!

The broader question (and concern) for predictive modelers is this: how do we recognize when we have uncovered spurious correlations in the data that are merely spurious? This can happen especially when we don't have deep domain knowledge and therefore wouldn't necessarily identify variables or interactions as spurious. In examples such as the election or stock market predictions, no amount of "hold out" samples, cross-validation or bootstrap sampling would uncover the problem: it is in the data itself.

We need to think about this because inductive learning techniques search through hundreds, thousands, even millions of variables and combinations of variables. The phenomenon of "over searching" is a real danger with inductive algorithms as they search and search for patterns in the input space. Jensen and Cohen have a very nice and readable paper on this topic (PDF here). For trees, they recommend using the Bonferroni adjustment which does help penalize the combinatorics associated with splits. But our problem here goes far deeper than overfitting due to combinatorics.

Of course the root problem with all of these spurious correlations is small data. Even if we have lots of data, what I'll call here the "illusion of big data", some algorithms make decisions based on smaller populations, like decision trees, rule induction and nearest neighbor (i.e., algorithms that build bottom-up). Anytime decisions are made from populations of 15, 20, 30 or even 50 examples, there is a danger that our search through hundreds of variables will turn out a spurious relationship.

What do we do about this? First, make sure you have enough data so that these small-data effects don't bite you. This is why I strongly recommend doing data audits and looking for categorical variables that contain levels with at most dozens of examples--these are potential overfilling categories.

Second, don't hold strongly any patterns discovered in your data based on solely on the data, especially if they are based on relatively small sample sizes. These must be validated with domain experts. Decision trees are notorious for allowing splits deep in the trees that are "statistically significant" but dangerous nevertheless because of small data sizes.

Third, the gist of your models have to make sense. If they don't, put on your "Freakonomics" hat and dig in to understand why the patterns were detected by the models. In our Redskin Rule, clearly this doesn't make sense causally, but sometimes the pattern picked up by the algorithm is just a surrogate for a real relationship. Nevertheless, I'm still curious to see if the Redskin Rule will prove to be correct once again. This year it predicts a Romney win because the Redskins lost and therefore the incumbent party (D) by the rule should lose. UPDATE: by way of comparison...the chances of having 17/18 or 18/18 coin flips turn up heads (or tails--we're assuming a fair coin after all!) is 7 in 100,000 or 1 in 14,000. Put another way, if we examined 14K candidate variables unrelated to POTUS trends, the chances are that one of them would line up 17/18 or 18/18 of the time. Unusual? Yes. Impossible? No!

Originally published at http://abbottanalytics.blogspot.com
by: Dean Abbott, President, Abbott Analytics, Inc.

Predictive Analytics World Toronto 2013

Rayid Ghani, Obama for America's Chief Data Scientist,
will provide keynote presentations at both
Predictive Analytics World San Francisco 2013 and
Predictive Analytics World Chicago 2013.

Read the full article at Time.com.

In late spring, the backroom number crunchers who powered Barack Obama's campaign to victory noticed that George Clooney had an almost gravitational tug on West Coast females ages 40 to 49. The women were far and away the single demographic group most likely to hand over cash, for a chance to dine in Hollywood with Clooney – and Obama.

So as they did with all the other data collected, stored and analyzed in the two-year drive for re-election, Obama's top campaign aides decided to put this insight to use.

They sought out an East Coast celebrity who had similar appeal among the same demographic, aiming to replicate the millions of dollars produced by the Clooney contest. "We were blessed with an overflowing menu of options, but we chose Sarah Jessica Parker," explains a senior campaign adviser. And so the next Dinner with Barack contest was born: a chance to eat at Parker's West Village brownstone.

For the general public, there was no way to know that the idea for the Parker contest had come from a data-mining discovery about some supporters: affection for contests, small dinners and celebrity.

But from the beginning, campaign manager Jim Messina had promised a totally different, metric-driven kind of campaign in which politics was the goal but political instincts might not be the means. "We are going to measure every single thing in this campaign," he said after taking the job. He hired an analytics department five times as large as that of the 2008 operation, with an official "chief scientist" for the Chicago headquarters named Rayid Ghani, who in a previous life crunched huge data sets to, among other things, maximize the efficiency of supermarket sales promotions.

Exactly what that team of dozens of data crunchers was doing, however, was a closely held secret. "They are our nuclear codes," campaign spokesman Ben LaBolt would say when asked about the efforts. Around the office, data-mining experiments were given mysterious code names such as Narwhal and Dreamcatcher. The team even worked at a remove from the rest of the campaign staff, setting up shop in a windowless room at the north end of the vast headquarters office.

The "scientists" created regular briefings on their work for the President and top aides in the White House's Roosevelt Room, but public details were in short supply as the campaign guarded what it believed to be its biggest institutional advantage over Mitt Romney's campaign: its data.

On Nov. 4, a group of senior campaign advisers agreed to describe their cutting-edge efforts with TIME on the condition that they not be named and that the information not be published until after the winner was declared.

What they revealed as they pulled back the curtain was a massive data effort that helped Obama raise $1 billion, remade the process of targeting TV ads and created detailed models of swing-state voters that could be used to increase the effectiveness of everything from phone calls and door knocks to direct mailings and social media.

How to Raise $1 Billion
For all the praise Obama's team won in 2008 for its high-tech wizardry, its success masked a huge weakness: too many databases.
continued >>>

SAS


Back then, volunteers making phone calls through the Obama website were working off lists that differed from the lists used by callers in the campaign office. Get-out-the-vote lists were never reconciled with fundraising lists. It was like the FBI and the CIA before 9/11: the two camps never shared data. "We analyzed very early that the problem in Democratic politics was you had databases all over the place," said one of the officials.

"None of them talked to each other." So over the first 18 months, the campaign started over, creating a single massive system that could merge the information collected from pollsters, fundraisers, field workers and consumer databases as well as social-media and mobile contacts with the main Democratic voter files in the swing states.

The new megafile didn't just tell the campaign how to find voters

and get their attention; it also allowed the number crunchers to run tests predicting which types of people would be persuaded by certain kinds of appeals. Call lists in field offices, for instance, didn't just list names and numbers; they also ranked names in order of their persuadability, with the campaign's most important priorities first.

Read the full article at Time.com.

Predictive Analytics World Online Training
Course outline, sneak preview, discount offers and registration

Read the full article at It World Canada.

Since April, IBM Canada has invested hundreds of millions into a research and development centre, an initiative to pool the collective knowledge of government, academia and the private sector to tackle issues of high public interest. Last week, the company announced it would partner with seven Canadian universities to aid them in their research on various medical conditions and the effects of climate change.

Shannon O'Connor, director of the IBM Canada Research and Development Centre, says the development of the Centre has been nothing short of extraordinary, not only in terms of the $210 million IBM has spent on it so far, but also in the robustness of the partnerships.

Throughout her career, she's been involved in numerous partnerships. But this is something else. "The collaborative spirit I see with this consortium is like none I've ever seen before."

The stakes couldn't be higher. Western University is trying to improve diagnostic tests for Alzheimer's disease, autism and schizophrenia, while McMaster University is developing software that can ensure the safety of insulin pumps.

These institutions join a veteran IBM partner, the University of Ontario Institute of Technology, which has been using IBM technology for health informatics for several years through an ongoing project called Artemis, which was launched to provide better and more precise health metrics.

It's the potential for life-saving innovations that O'Connor says are the most compelling aspects of her work.

"The human impact is phenomenal," says O'Connor. "What excites me – and I would put the McMaster project in this category – is the true business value impact of some of these projects," she says.

"That software certification project will save lives by improving insulin pumps.

continued >>>

These institutions join a veteran IBM partner, the University of Ontario Institute of Technology, which has been using IBM technology for health informatics for several years through an ongoing project called Artemis, which was launched to provide better and more precise health metrics.

It's the potential for life-saving innovations that O'Connor says are the most compelling aspects of her work.

The human impact is phenomenal," says O'Connor.

"What excites me – and I would put the McMaster project in this category – is the true business value impact of some of these projects," she says.

"That software certification project will save lives by improving insulin pumps. The Artemis expansion project will save lives, and will dramatically reduce the cost of health care by enabling us to identify unhealthy infants and directionally unhealthy adults sooner so we can take action on it."

Carolyn McGregor is a professor at the University of Ontario Institute of Technology, and also holds the Canada Research Chair in Health Informatics. She's been deeply involved in the Artemis project from the beginning.

One of her most pressing concerns is finding ways to look for the subtle hints that infants are suffering health problems before it's too late.

Predictive Analytics World Call for Speakers

Salford Systems

Hospitals use a variety of devices to keep track of vital signs, including heart rate monitors, machines that measure respiration through chest movement, and probes that indicate blood oxygen saturation.

But historically, it wasn't easy to dig deep enough to find possible interactions between all of these data points. So hospitals would simply consolidate the information flowing in.

For instance, says McGregor, a baby's heart beats around twice every second, and the number of beats is tallied over the period of an hour. "There are 7,200 times, roughly, that a baby's heart will beat in that hour, and they write one number down," she says.

"So, we're missing a lot in terms of subtle trends and behaviours," she adds.

"There's been early research that's shown that if you watch much more closely every beat every breath you can start to detect conditions that the baby's developing, because the body's coming under stress–it has certain responses to that–and we can start to pick these things up."

Read the full article at It World Canada.


PAW


 Rising Media   Prediction Impact